Interactive Ocean Atlas
Halcyon Atlas

Overview
The museum’s new gallery needed a companion that worked on a phone at the exhibit and on a laptop at home. Rather than a map you pan across, we built a descent: one continuous scroll from the surface to the seabed, with every depth band holding the species, wrecks and currents that live there.
Light fades and colour shifts toward teal as you sink, driven by real attenuation data from the museum’s research team. Bathymetry is rendered as a slow WebGL relief you can tilt with a finger. Labels are set small and kept sparse, so the water does most of the talking. The atlas now ships with every exhibition ticket.
halcyon-atlas.com


Fig. 01
Collection — objects from the archive, creatures from the deep

halcyon-atlas.com

Fig. 02
Surface layer — tides and swell, updated hourly
Fig. 03
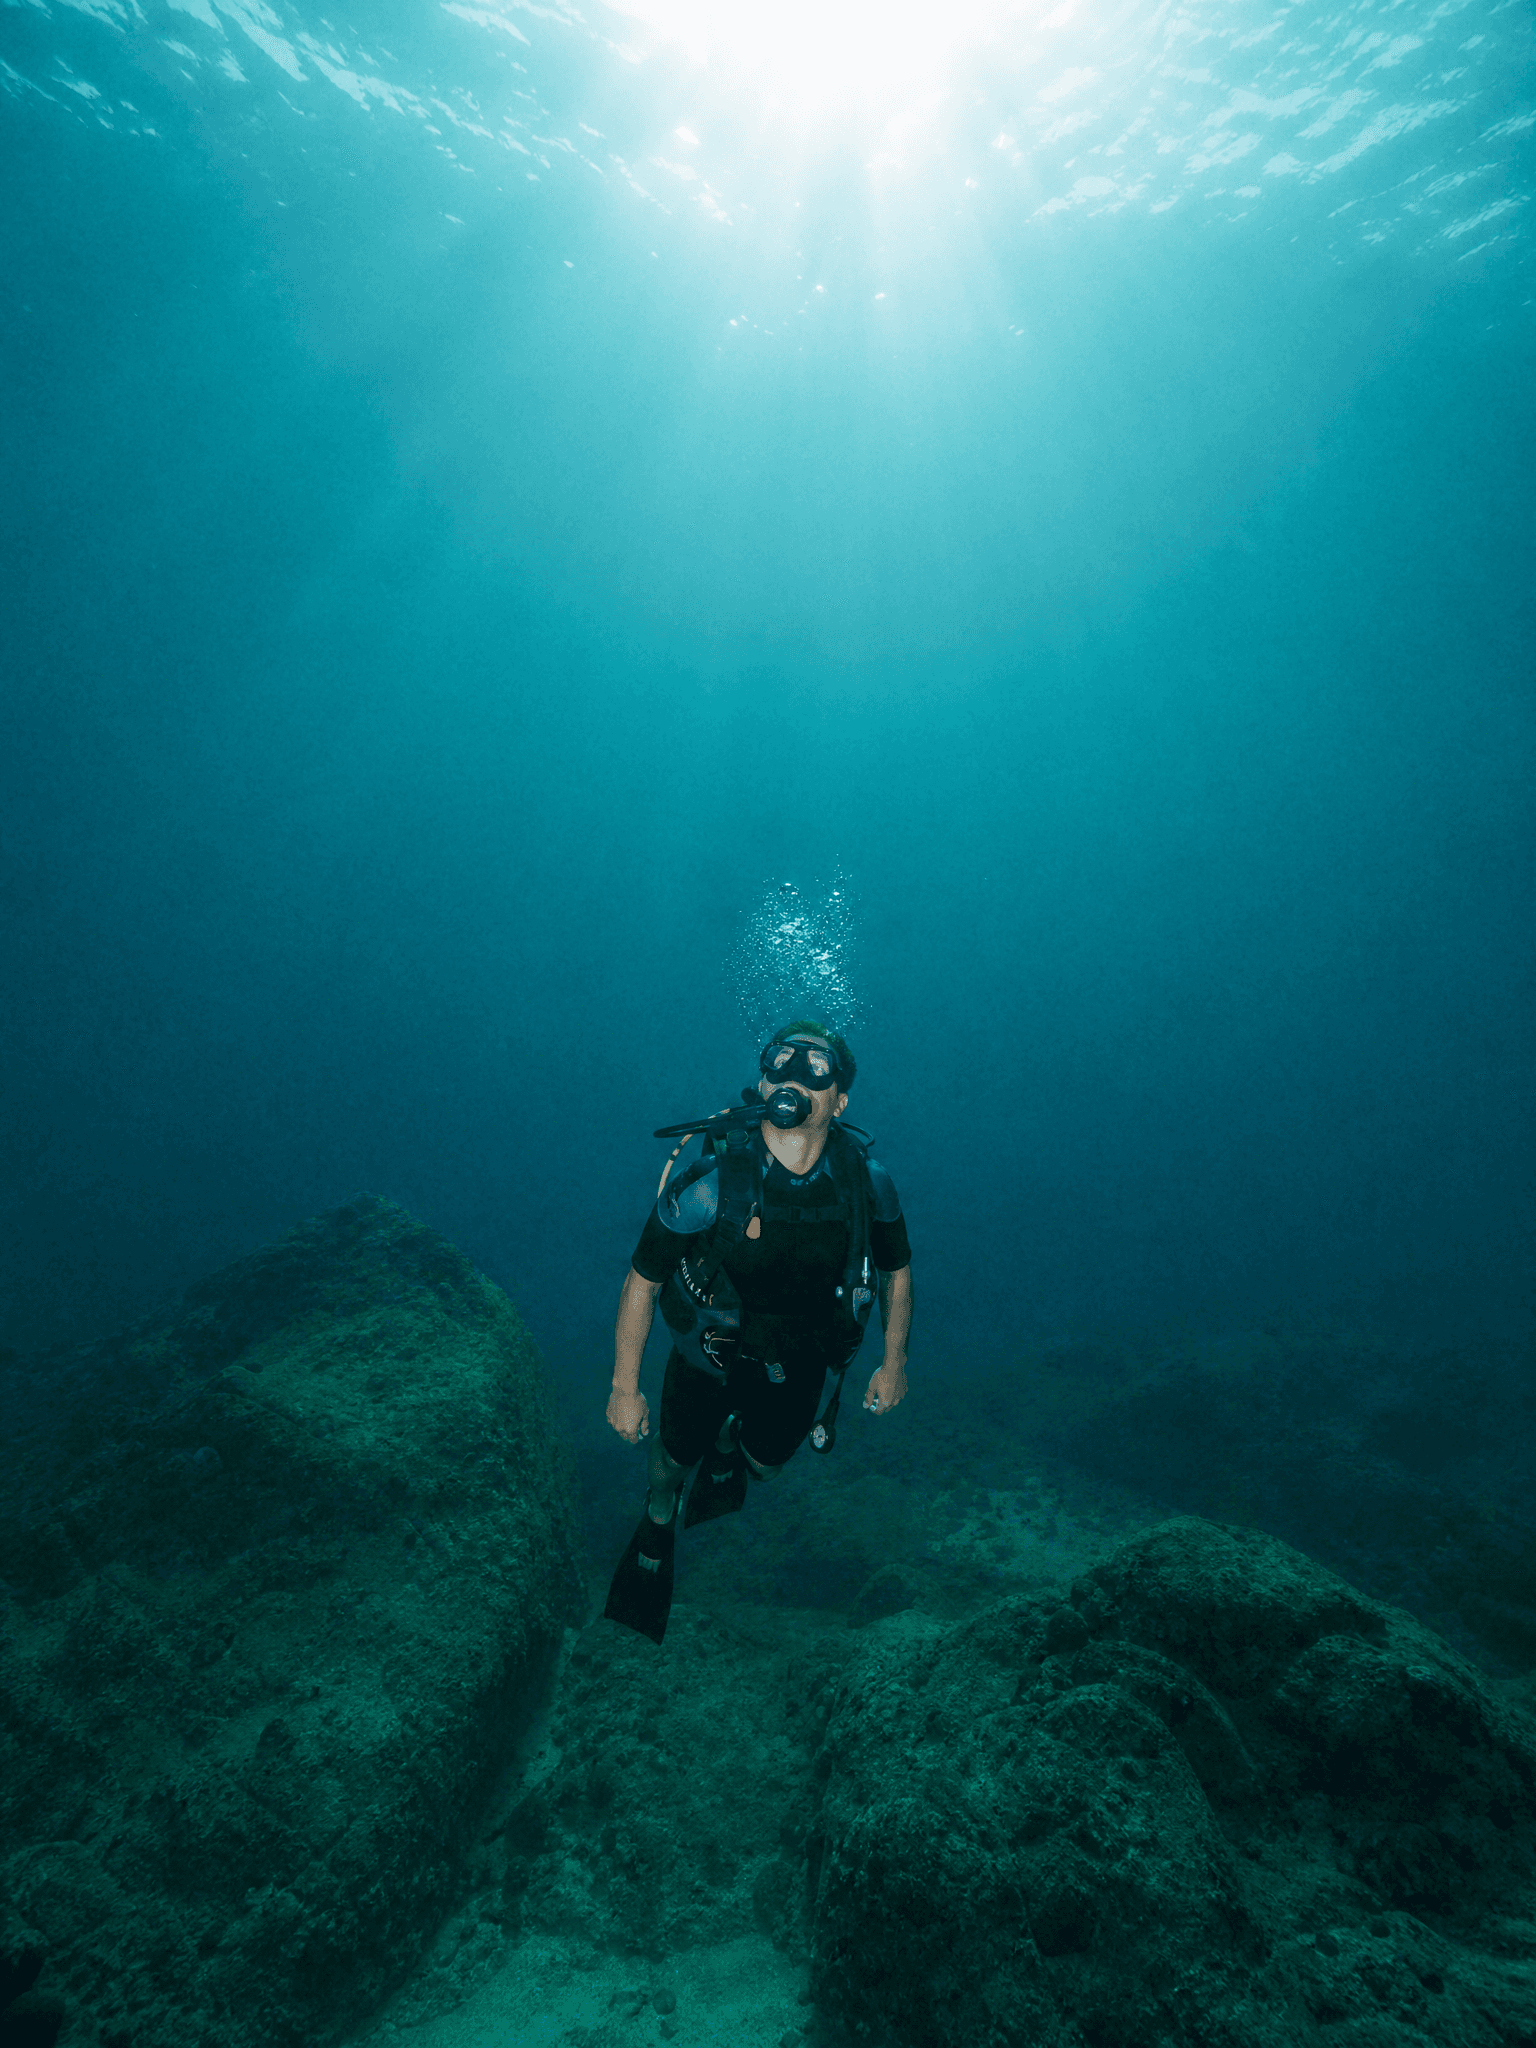
Depth 40 m — the point where red light disappears
Credits
Interaction & development — Noor Calder · Research — Dr. Leonor Matos · Illustration — Kai Brennan · Sound — Rui Falcão